Friday, 24 April 2009

Arthur Rörsch's bizarre way of conducting science

Arthur Rörsch cherrypick Hans Labohm
Arthur Rörsch
Follow up to the previous blogpost which was dealing with a Labohm/Rörsch text published on three Dutch denier websites simultaniously

A Dutch blog called Sargasso also noticed the clear cherry-picking and demonstrates what happens if you prolongue the graph Labohm/Rörsch (L&R) use : blogger Steeph went to the NASA-GISS data set and instead of using L&R's ten year timespan he randomly added some extra data: 1,5 year at the beginning, one month extra at the end.

The result can be seen in this graph. Suddenly the temperature decline changed into an increase, and a fast one. Steeph correctly concludes that the chosen timespan by L&R strongly influences the result and that the authors carefully selected the data to get a drecreasing trend. Clearly the definition of a cherry-pick.

Steephs criticism resulted in this comment by Rörsch (my translation)
I think Sargasso presents statistical bullshit. Why, i will explain in future publications

I'm anxious to see what his explanation will be, but he already gives a clou in the comments section of his Klimatosoof article :

in my previous comment i already mentioned what i consider to be sherry pikking [presumably this is humor. J] : It's solemly considering a linear trend without considering other [sinusoïdal] curves.
I have the feeling Rörsch is so obsessed with sinusoïdal curves he fails to understand what the cherry-picking citicism he receives actually is about, which makes him both ignore the criticism and makes him adressing a strawman's argument instead. In the comments section of the Klimatosoof i copied Steeph's graph with the extended time span and the effect on the trend.

Rörsch's commented :
The graph presented by Jules clearly shows a linear trend (on the X-axis the years are missing, but we can understand which period is depicted).
What Rörsch said is painfully incorrect : in my comment i clearly mentioned the graph prolongued Labohm's famous graph a little bit. Rörsch must have missed that sentence. Above that I also clearly put a link to the original Sargasso-piece. Rörsch must have missed that link.

The result is Rörsch actually is confronted with a graph of which he doesn't know what timespan it is dealing with.

Which strangely enough doesn't stop him from commenting on it anyway :

I think no-one will deny this linear trend. It is a result of the recovery of the last ice-age, on which was superposed the one of the Little Ice Age in our Golden Age [in Dutch, the sentence is just as weird, i'm translating it as it is. The Dutch Golden Age roughly spans 17th century]
As said, the Sargasso-graph deals with the last 11 years. Rörsch's comment is adressing a totally different period and is ridiculously wrong.


Resumed, this is what you need to do to repeat what Rörsch has done :
  1. see something [in casu : a graph] you don't know
  2. do not read the explanation given to it
  3. Don't let the fact you don't have a clou what the graph is about stop you from fabricating your own theory on it.
  4. do not check whether that theory actually is correct [it isn't, we are not just into a recovery of the last ice-age]
  5. do not check whether that theory actually adresses the topic in the first place...
Inadvertently, Rörsch has given a brilliant insight in the way he conducts science ...

Tuesday, 21 April 2009

Arthur Rörsch's bizarre ideas on cherry-picking


I know i've been absent from blogging for a while but my job, involving real science, still has priority.

Yet simply have to mention this post by Hans Labohm published on Theo Richels website Klimatosoof which presents a paper written by Prof. dr. ir. Arthur Rörsch (a 75 year old emeritus in biochemistry actually, but that's qualifications enough to be a prominent climate skeptic nowadays) in which he summarizes some of his objections towards climate science (my translation, my emphasis) :

Arthur Rörsch
Arthur Rörsch
Observations show that CO2-concentrations since the beginning of the century has risen some 5,5% while there was no worldwide temperature rise. There are even some indications since 2006 temperatures have been decreasing, and this trend will continue in the next decade.

The article on the Klimatosoof was written in responce to the Dutch PCCC-report.

PCCC stands for Platform, Communication on Climate Change and is a collaboration of several Dutch scientific research centres. Recently PCCC presented the brochure 'de staat van het klimaatonderzoek 2008' (Dutch only, the title means 'climate research roundup 2008')

Amusingly, given the quote above using a three year temperature trend, Rörsch (or Labohm ?) accuses PCCC of cherry-picking : he complains "PCCC presents a misleading graph" for the time period 1900-2008 which could make the people think earth has been warming as "it gives an impression of a continuous rise".

So, if i may believe the Klimatosoof article presenting the entire available data set that is available (1900-2008) is called "cherry-picking", while isolating 3 single years out of that very same dataset is called "science".

The PCCC-graph which gets attacked looks similar like this one from NASA:
Earth Temperature


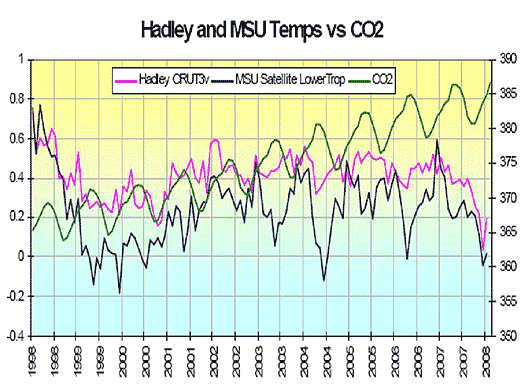
Rörsch/Labohm, instead of using all those data in the graph ditch all data that doesn't fit their predesigned conclusion. Instead of using this 100 years-timescale they present a graph which looks amazingly familiar as it's Labohm's well known misleading graph of the past decade:
Arthur Rörsch carbon dioxide temperature cherrypick on El Nino La Nina


A. Rörsch has bewildering ideas on science.
Hans Labohm remains a fraud.


Actually Rörsch presents the graph in a context that CO2-levels in the atmosphere don't correlate all that much with temperature. I believe i linked to it before, but this post on More grumbine Science is a must read on the correlation between the two.

UPDATE : Do also read Rörsch' mind numbing post in the comments section of the article

Thursday, 12 March 2009

Labohm. Again. Sigh.

Hans Labohm(start here) is fond of repeating the same meme over and over again. Long after it has been disproven. And long after there has been demonstrated that he knows and understands what he says is misleading.

August 23, 2008, on the libertarian website Vrijspreker, Labohm presented a graph showing "for the past decades, there's no correlation between CO2 and temperature"


Hans Labohm Fraud cherrypick Joe d'Aleo Icecap


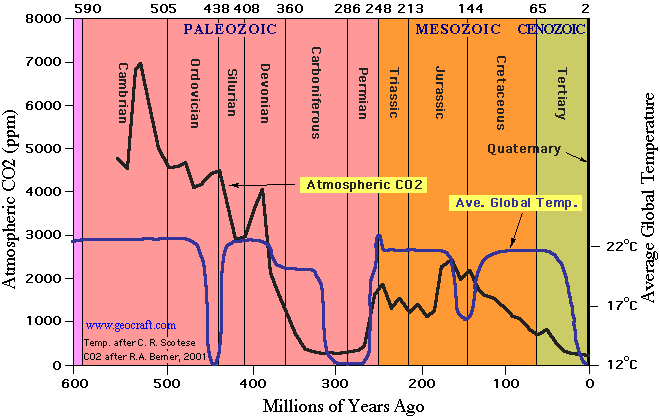
As he got the remark he cherry-picked his data, Labohm wrote a follow-up article in which he still uses a graph with a misleading timescale (as earth litterally was a diifferent planet in a time there were no trees yet)

Hans Labohm fraud cherrypick misleiding CO2 temperatuur

But finally he also presents this graph which is the one we need :

CO2 temperature correlation Vostok ice

This image leaves no doubt that indeed there is a correlation between CO2 and temperature. And that because of its short time interval, the first graph Hans Labohm presented was misleading. Which of course could be undeliberately and by no means is a proof of dishonesty.


Yet, in the third edition of Jason Magazine (jg 33), Hans Labohm presents this graph

Hans Labohm fraud Joseph d'Aleo Icecap cherrypick

he 'explains' :there's no a single correlation between temperature & CO2 (...) there's not a single timescale showing a correlation between CO2-concentrations in the atmosphere and temperature.
Of course, as the third graph above (a graph he himself posted) already showed, there absolutely is a correlation.

In the next edition of the magazine, Dutch student Desi Van de Laar wrote a rebuttal to Hans' text. In which she posts a graph showing the correlation.

The graph looks a bit like this one :

Relatie CO2 en temperatuur ijskern
Clearly, this is the second time Labohm has been shown his statement is false.


Hans wrote a rebuttal (jan 6, 2009) adressing Van de Laars rebuttal. A text he concludes with :

the last decade earth has been cooling, despite a CO2 rise. This presumably leads to the conclusion that CO2 isn't such an important factor in determing earth's temperature.
He present a graph to depict his words :
Hans Labohm manipulatie cherrypick
This is the second time he ignores the proof presented to him that his statement is false.

Back then, i did blog about it (posts he read), which means he's seen the evidence he's wrong no less than three times.


February 13, 2009 : Labohm writes a post on De Dagelijkse Standaard in which he writes :

The main thing is that since ten years earth has stopped warming while CO2-levels kept rising. This suggests there's not any causuality between CO2 and global warming (which isn't there any more anyway). Better than a thousand words, this graph shows what it's all about.
The graph hidden under the hyperlink is this one :


In the comments section, someone complains the time interval Labohm presents is way too short to be meaningful.

The same day Hans Labohm wrote this follow up post to adress this comment in which he answers :

Good point ! But no time scale will ever show a correlation between CO2 and Temperature. QED. P.ex. Look here
Of course, Hans' statement is wrong. And he knows very well that it is.


March 4, 2009 :Labohm publishes a post on De Dagelijkse Standaard which begins with :

(...) the temperature trend (which - i'll repeat it once more - shows no correlation with the level of atmospheric CO2) (...)

Once again Labohm is critisized by the readers of the site for his graph the commenters call 'misleading'. Hans replies by giving a link to this graph :

and this graph

So once again, Labohm HIMSELF presents the graph which clearly shows the correlation.

Interestingly, in this post he admits a ten year period is too short to support his claim that earth stopped warming a decade ago.


March 12, 2009 : Hans mailes around an article of his - published in the March-edition of the magazine Research Review.

Hans writes (remember, on DDS he admitted that a ten year temperature trend is meaningless) :

The illustrated graph shows declines in temperatures measured by surface and satellite thermometers over the last 10 years, while the CO2 concentration in the atmosphere still rises. It indicates that over this period there has been no warming, but cooling. It also shows that CO2 is not correlated with temperatures, which suggests that it has only little impact, if at all. The graph, which is based on the measurements of the official scientific institutions, is the best-kept secret of the ‘warmoholics’.
of course there's a graph (coming from the known unreliable source icecap from Joe d'aleo) to picturise Hans' words
Hans Labohm manipulation of data


i'm wondering which graph will accompany my next post on Hans Labohm...

UPDATE 1: March 13, 2009, in the comments section of De Dagelijkse Standaard, Labohm writes :
Not one timescale -millions of years, thousands, hundreds or tenths of years- shows a correlation between CO2 and temperatures.


UPDATE 2: March 17,2009 , Hans did it again in his post on De Dagelijkse Standaard :
Not one timescale -millions of years, thousands, hundreds or tenths of years- shows a correlation between CO2 and temperatures.
The graph behind the hyperlink is ...


Do notice
he does NOT provide links for the other timescales.
Which is no surprise, as he has demonstrated himself that such graphs actually would disprove his statement.


UPDATE 3 : March 24, 2009, Hans Labohm did it again :
no timescale shows a correlation between CO2 ans temperature. The last ten years earth has been cooling while cO2-levels kept rising.
The illustration behind the hyperlink is this one :

Hans Labohm De Dagelijkse Standaard libertarisme VVD PVV


UPDATE 4 : April 21, 2009, Hans Labohm presents a familiar graph :


UPDATE 5 :
i've stopped updating this post for half a year because i got bored, but allover this period Labohm has been using the very same "argument" over and over again.
Latest attempt to fool the audience : today, November 9, 2009, in this post on De Dagelijkse Standaard, accompanied by a graph we all know by now .
Labohm writes :

This graph illustrates (...) there's no correlation between CO2 & temperature, implying one can assumle there's no causality either.

UPDATE 6 :

November 16, 2009 In a guestlog on the Dutch NOS site, Hans Labohm writes :
The average temperature has been decreasing the past ten years, while CO2-levels int he atmosphere is still rising
This words are illustrated with this graph :


UPDATE 7 :
Last weekend, Labohm publised an article in the Dutch newspaper "Trouw". A prominent place in the article went to this graph :


UPDATE 8 :
December 14 2009
This page, by far, is the most visited one on my blog and as a result more and more people start asking Labohm why he keeps on using that misleading graph again and again.

Of course Hans never answers that question. But as he did get so much opposition on the NOS-weblog, he started trying other graphs that are equally misleading.

Labohm's posts belong to a series of a debate between him and real scientists. Bart Sprengers used the opportunity to write a post asking Labohm about his use of misleading graphs.

Here's what Labohm answered :

Bart asks : why did you show a graph showing temperatures in US, while the text was suggesting it would be about global temperatures ?Answer : it was graph that was easily available on the internet. But now i found another graph, showing a different picture. No correlation between cO2 and temperature !

I have a feeling this is not the last time seeing this new graph...


UPDATE 9 :
june 6, 2010
Once again i haven't been following Labohm but i just stumpled upon his presentation at the fourth international climate conference organised by the heavily Exxon-funded Heartland Institute. In his presentation, Labohm is showing the following graph to 'proof' there's no correlation between CO2 and temperature :
Hans Labohm klimaatsceptici misleiding

Conclusion
In his posts, Hans Labohm is presenting misleading facts, and given the chronology mentioned above, there's not doubt at all he isn't fully aware of the misleading nature of the facts he presents.

Hans Labohm is not wrong, Hans Labohm is a fraud.

Monday, 9 March 2009

Hans Labohm in De dagelijkse standaard.

Hans Labohm S. Fred Singer lie
In Holland a new website called De Dagelijkse Standaard was found to give a tribune to a couple of conservative writers to spread their worldview.

Of the contributors, best known in Belgium is Dutch columnist Derk Jan Eppink who recently announced to candidate for Lijst De Decker in the next European elections.

Another sounding name is Hans Labohm for whom the site has become his personal playground, with a daily post of his visions on climate science. I never took the trouble to comment on what Labohm wrote over there because it's simply too much too debunk and he's simply repeating the same things over and over again.

I couldn't resist though to give a few comments on the website (i know, i know, don't mock me) and once again stumbled onto something i couldn't believe.

Labohm made a post in which he's not saying much more than that S. Fred Singer wrote this text.

I replied (amongst other things) that S. Fred Singer received fundings from the industry.
Labohm tries to deny Singer received money saying:

Unproven. Made up. Slander.
The strange thing on this statement is that 3 monts earlier, on December 30, 2008 i received an email from Hans in which he admits Singer received money from Exxon.

Instead of denying Singer received fundings, in the mail he sent me Hans Labohm is drawing the card Singer didn't receive all that much money... So Labohm is perfectly aware Singer received fundings from the industry.

Could it be someone is making statements on DDS he knows to be untrue ?


UPDATE : Meanwhile on DDS, Hans Labohm replied to what i said. His two main points are :

  • this has nothing to do with climate science. Even if it would be true -which is unknown to me (remember that not only he sent me a mail in which he admits to be aware Singer received money, but on DDS i reminded him of the existance of this mail - J) it is not relevant.
  • "jules should not be allowed to post on De Dagelijkse Standaard any more"

The NIPCC rapport Labohm often cites was well funded: S. Fred Singer declared it was worth143.000 US $.

Wednesday, 4 February 2009

Hans Erren vs the people of Shishmaref

In his blog on the Dutch newspaper Volkskrant called klimaathype (i suppose this needs no translation), skeptic Hans Erren presents his views on Global Warming.

Shismaref Shishmaref Sarichef global warming
Erren's latest post is comparing the Dutch Wadden Sea island Vlieland with the Alaskan island Sarichef where the Inuït Village Shishmaref is located. The island received some attention in Holland because of the movie The Last Days of Shishmaref by director Jan Louter, which tells the story of the islanders who fear they'll have to move to the mainland as their island slowly gets swallowed by the sea.

The Wadden Islands (or Frisian Islands) including Vlieland, are a chain of islands in the North of Holland and continuïng in Germany until the border with Denmark.

Basically the islands are sandplates sticking out above sea level, and therefore the tide has great influence on their shorelines. Mankind has done efforts to decrease erosion in order to slow down natural processes, but of course the process itself cannot be fully halted.

At the erosion side, the islands shrink while at the other side progradation makes them grow. As a result the shorelines are ever moving and in Dutch we say the islands are "walking". Because of erosion, in 1736 on Vlieland an entire village (Westeynde) was swallowed by the sea.

Erren compares the present events at Sarichef, a small (7 km long) sandy island in Alaska, to what has happened to Vlieland in the past.

Sarichef island also knows a lot of erosion, to such an extent the islanders are worried their entire village might disappear in the nearby future as erosion is taking away a couple of metres of land every year.

There are several different natural causes for this erosion, yet some effects can be linked to global warming. The arctic area in recent times has known a fast increase in temperatures, causing the permafrost to melt, making the soil more vulnerable for erosion. Above that, increased temperatures result in less sea-ice, ice which serves as a natural storm surge.

The AAAS-website has a longer article on the subject : In Arctic Alaska, the Warming Climate Threatens an Ancient Culture


On the Volkskrantblog, Hans Erren writes (my translation) :

Hans Erren global warming Shishmaref Sarichef
Hans Erren
Sarichef is a Wadden Island in Alaska, comparable to Vlieland. For the inhabitants from the village Shismaref the same fate is waiting as the inhabitants of Westeynde. They only just started living there and aren't used to walking islands, therefore they blame climate change.

That's why they don't want that the island to 'disappear in the sea".
Is the Island disappearing ? Well, no. It's just moving a little bit. At the South-West side, there's a strong growth, just like on Vlieland.

Of course, even without AGW there'd be erosion on Sarichef, that much is true. But as mentioned above, global warming probably increases erosion. Yet even if AGW is a hoax, there are two very clear problems with Erren's words. Erren writes :
  • They only just started living there and aren't used to walking islands
It's clear Erren wants to make his readers think the islanders simply aren't aware of natural processes on such islands. What he doesn't mention is the area has been inhabited for hundreds of years already. All that time, the 'walking-island-effect' has occured, and the inhabitants know the phenomena.

  • Is the island disappearing ? Well, no, it's just moving a little bit. At the South West Side, there's a strong land-growth, just like on Vlieland.
in the comments section, Erren is asked for some more information and a source for his claim. His answer is nothing but an attempt to distract attention from the question :
All i can do is point out the similarity in geometry between Vlieland and Sarichef. For the Wadden Islands there's this map by Gerbrand Gaaff (...) Progradation at the South, Erosion at the North Side.
Clearly, he doesn't even get close to answering.

I spent an hour to find a source which supports Erren's statement but all i could find was info (p.ex. in Living with the coast of Alaska by Mason et al.) which says the island doesn't grow on the South-East as Erren states, but actually is lenghtening to the North-East

Meanwhile on the volkskrantblog, Erren again is asked for sources. Given the red herring in his first reply, I'm rather curious now what he's going to say.

Friday, 23 January 2009

Libertarism, climate change and tobacco part II : Vincent De Roeck is unhappy

Earlier i reported the Dutch libertarian website vrijspreker.nl, besides denying man's role in the present global warming, also has been heavily opposing a ban imposed by the Dutch government on smoking in public places.

On their website, they promoted the TICAP-conference with close connections to the tobacco-lobby to oppose such prohibitions.

Vrijspreker today announced that the conference has been cancelled by the EU. Apparantly the reason for this is a violation in the EU rules. The person they got the news from is someone with a very familiar sounding name ... young Vincent De Roeck whoms vision on global warming already has been adressed.

Vincent De Roeck is unhappy he's not going to be able to be fooled by the tobacco-lobby conference dressed up as a freedom of speech conference (my translation):

Vincent De Roeck Margareth Thatcher Global Warming klimaatverandering
Vincent De Roeck and the Iron Lady
it's a scandal. I was inscribed for a anti-prohibition conference next week in the European Parliament. Today i discover the bureau of the EP has prohibited it. Freedom of speech ? A typical deed from that disguisitng EUSSR.

An article with some more background on the TICAP-conference and the interesting career of Dr Gio Gori (whom was gonna give the talk "The passive smoking fraud") can be found in the article Parliament acts against commercial interests in the EPOnce again we can see the close ties between libertarians and an industrial lobby, probably because the industry is drawing the card of using the libertarian bias towards "freedom without government intervention" as it seems to be the ways to get libertarian support : somehow there grows a situation where libertarians will claim there's no need to act on ... [insert scientific subject], while the industry is willingly giving them plenty of financial means to spread the viewpoint there's no need for government action on the subject.

People with a firm biological background would call this the perfect symbiosis !

Tuesday, 20 January 2009

Hans Labohm's continuous dishonesty


Hans Labohm dishonesty manipulatie & leugens
Earlier i've demonstrated that Hans Labohm has been deliberately misleading by choosing a graph that uses a timescale not suited to support his conclusion there's no correlation between CO2 and temperature.

I've also mentioned that after severe criticism on his post, Labohm was forced to write a second article, in which he posted a graph that leaves no doubt there IS a correlation.

He published this extra post on August 25, 2008.

This implies that, as he's proven to be aware of the correlation, Labohm after this date cannot deny this relation any more. Or can he ?

Exactly the same CO2/temp-correlation argument he used in the article I commented on my blog, was repeated in another article that was published in the Dutch JASON-magazine. (the article itself isn't online)

Just as on the vrijspreker website, Labohm received a lot of criticism on his writing. In an 'official' rebuttal in the magazine's next edition by Desi Van de Laar, a student in politicology, presented a graph which clearly demonstrates the correlation.

Hans Labohm has written an answer adressing her remarks which hasn't been published (yet?), but he did sent the draft to his entire mailing list. He did so on January 6, 2009. Or half a year after there has been demonstrated on the vrijspreker website that the CO2-temperature correlation he denied does appear when choosing the correct timescale. Which also was demonstrated by Van de Laar. And again, on my blog on december 26, 2008

Therefore you might assume Labohm would not be using the same debunked graph again to deny the correlation between CO2 & temperature ? Well, here's the funny part ... The answer to Van De Laar he mailed around reads (my translation) :

IPCC-climatologists concluded that man has a substancial influence on the present day warming. Yet the last decade earth has been cooling, despite a CO2 rise. This presumably leads to the conclusion that CO2 isn't such an important factor in determing earth's temperature.
A passage he finishes by presenting ... the very same graph again...
Hans Labohm is a fraud

Given the date he mailed this last text, Hans Labohm is aware that his graphic is misleading.

Hans Labohm is a total fraud.

update : Labohm keeps being dishonest by repeating this same graph over and over and over